What Does MPG Mean?
Ever looked at a window sticker and wondered what does MPG mean? The short answer is miles per gallon. It measures how far a vehicle travels on one U.S. gallon of fuel. The longer answer is more useful. That sticker number comes from laboratory conditions, and those conditions only partly resemble your commute. Learn how the figure is generated, how to calculate your own, and what drags it down. Then the number becomes something you can act on.
How Is MPG Calculated?
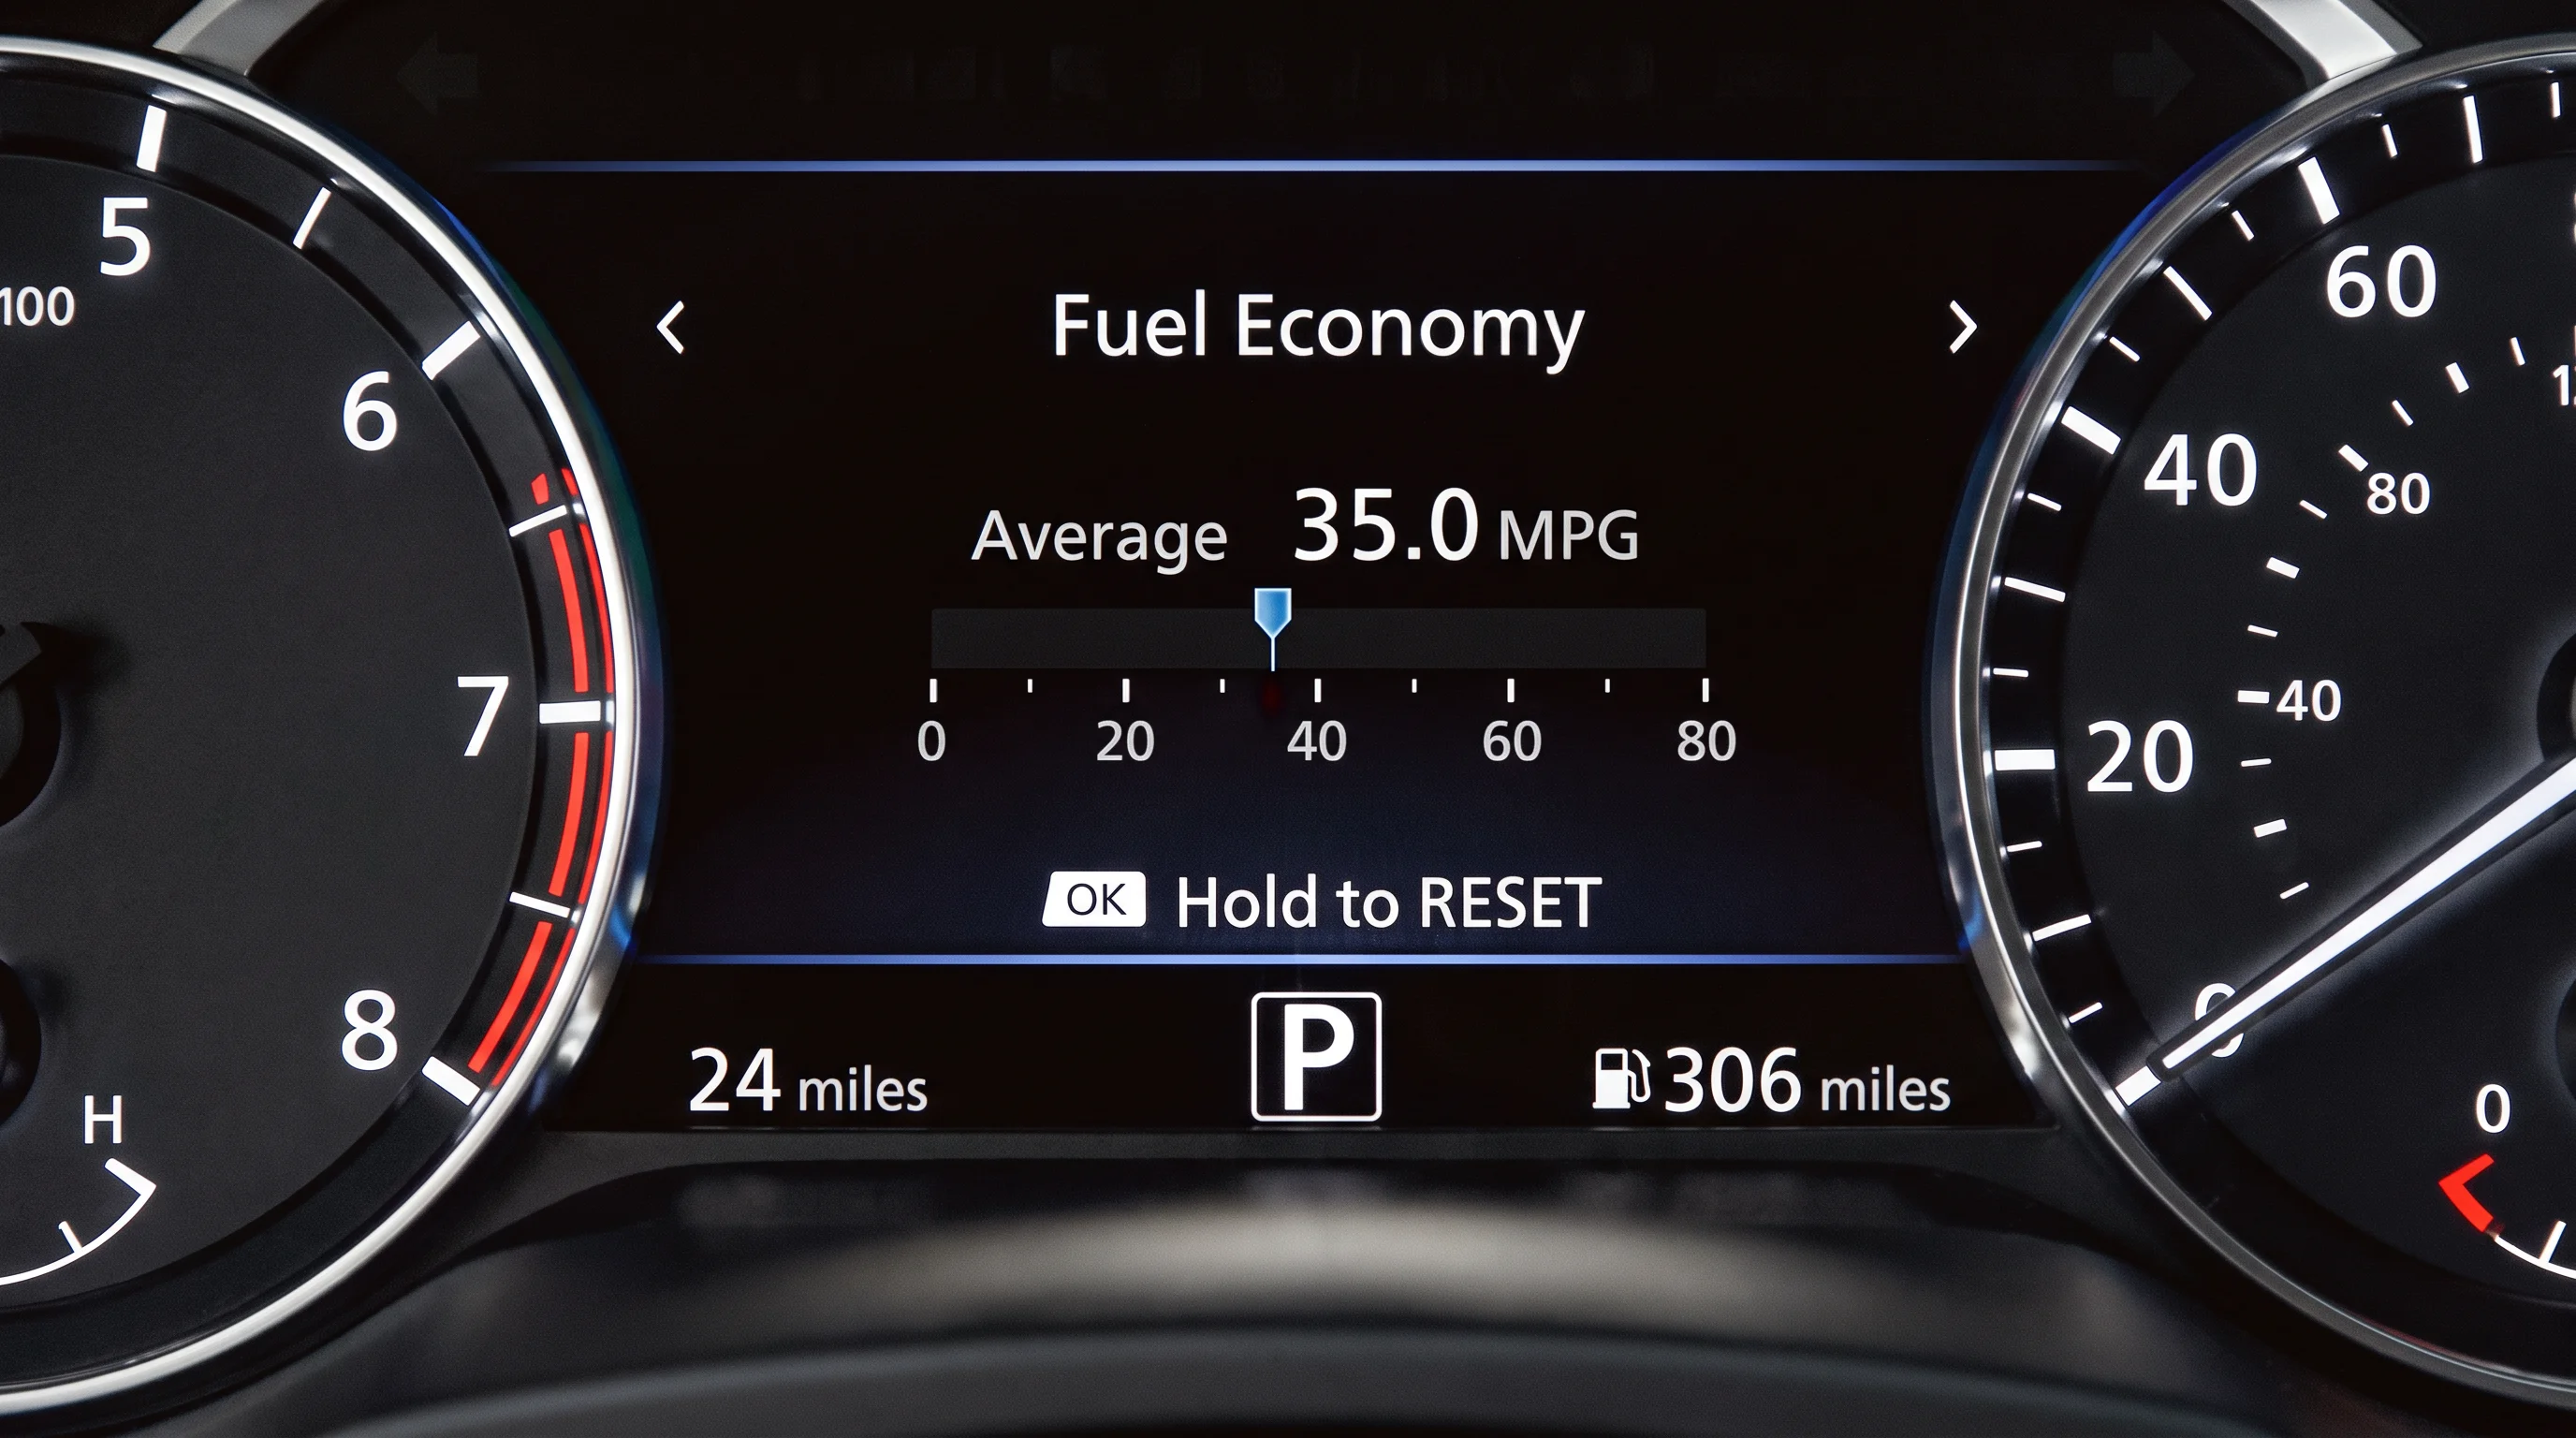
MPG is calculated by dividing total distance driven by total gallons of fuel consumed. Travel 300 miles on 10 gallons and you have averaged 30 MPG. That single formula underpins every fuel economy figure you will encounter, from the window sticker to the readout on your dashboard.
Vehicles that run on electricity use the same idea, adapted into MPGe. That stands for miles per gallon of gasoline equivalent. The EPA fixes one gallon of gasoline at 33.7 kilowatt-hours of energy. So a vehicle traveling 100 miles on 33.7 kWh is rated at 100 MPGe. Electric vehicles and plug-in hybrids carry MPGe on their labels. It lets you compare their energy efficiency directly against a gasoline engine.
How Does the EPA Test Fuel Economy?
The U.S. Environmental Protection Agency defines the methods behind the fuel economy estimates on every new window sticker. Automakers run the tests and submit the data. The EPA independently confirms roughly 15 percent of results.
The Five EPA Test Cycles
Since the 2008 model year, vehicles have been evaluated across five standardized laboratory cycles on a chassis dynamometer. Each one isolates a different set of conditions, and together they produce the city and highway figures you see at the dealership. The EPA publishes the full attributes of each cycle.
| EPA-Estimated Test Cycle | What It Simulates | Top Speed | Average Speed | Idle Time | Lab Temperature | A/C |
|---|---|---|---|---|---|---|
| City | Stop-and-go urban traffic, cold engine start | 56 mph | 21.2 mph | 18% of time | 68–86°F | Off |
| Highway | Free-flowing rural and interstate driving, warm engine | 60 mph | 48.3 mph | None | 68–86°F | Off |
| High Speed | Higher speeds with harder acceleration and braking | 80 mph | 48.4 mph | 7% of time | 68–86°F | Off |
| Air Conditioning | Climate control under hot conditions with full sun load | 54.8 mph | 21.2 mph | 19% of time | 95°F | On |
| Cold Temperature | City driving pattern in cold weather, cold start | 56 mph | 21.2 mph | 18% of time | 20°F | Off |
Most drivers underestimate the air conditioning cycle. It runs at 95°F with the climate control active. It also spends roughly a fifth of its duration at idle. That is a deliberate stand-in for a hot, congested summer commute.
EPA-estimated fuel economy figures are for comparison purposes only. Your actual mileage will vary depending on driving conditions, how you drive and maintain your vehicle, battery age/condition, and other factors.
What Is the Step-by-Step Formula to Calculate MPG Using the Trip Odometer?
The formula is straightforward. Miles driven divided by gallons pumped equals your real-world MPG. Getting an accurate answer depends less on the math than on being consistent at the pump.
- Fill the tank completely until the nozzle shuts off automatically, then reset your trip odometer to zero.
- Drive normally until the tank drops to roughly one-quarter full or lower.
- Return and fill completely using the same automatic shutoff standard, then record the exact gallons pumped from the dispenser display or receipt.
- Note the trip odometer distance before clearing it.
- Divide the trip mileage by the gallons added at that fill-up.
If your trip counter reads 350 miles and the pump dispenses 10 gallons, you averaged 35 MPG.
Drivers often ask whether the trip odometer beats the dashboard computer. Doing the arithmetic yourself gives you a baseline grounded in gallons you actually purchased and miles the odometer actually counted.
How Do I Track Gas Mileage Manually Over Time?
A single tank tells you very little. Pump shutoff sensors vary. Temperatures swing. One unusual traffic week can distort the result. As a general practice, record three to five consecutive full tanks instead of relying on one. Averaging across several tanks reduces the effect of any single outlier.
What to Log
Keep a notebook, a spreadsheet, or a phone app. Log the same fields each time: date, total odometer reading, trip distance, gallons added, and calculated MPG. Add a short note on conditions, such as heavy highway travel or towing.
Handling Partial Fill-Ups
Partial fill-ups need care. A partial fill hides exactly how much fuel a given distance consumed. Record the gallons added, but wait to calculate. Once the tank is completely full again, sum every intermediate fill. Then divide cumulative trip miles by that combined volume.
Using Your Log as an Early Warning
Over time, a fuel log becomes an early warning system. An unexplained drop across consecutive tanks is worth investigating. Tire pressure is the most common culprit. The Department of Energy notes that underinflated tires and the wrong grade of motor oil both reduce gas mileage. A check engine light matters too. A modern vehicle can drive normally while a fault quietly cuts efficiency. That is why the Department of Energy advises having it inspected rather than waiting. You can find more guidance across our service and parts tips library.
The information in this article is general guidance and does not constitute a specific diagnostic or repair recommendation for any individual vehicle. Repair and maintenance decisions should be made in consultation with a certified technician based on the specific condition of your vehicle.
What Is the Difference Between City, Highway, and Combined MPG?
City MPG reflects low-speed urban driving with frequent stops and idling. Highway MPG measures sustained cruising on open road. Combined MPG is a weighted average of the two. The EPA weights the city figure at 55 percent and the highway figure at 45 percent. That combined number is the most useful metric for comparing one vehicle against another.
The gap between city and highway figures says a great deal about a vehicle’s powertrain. City test schedules punish weight and idle time. Highway schedules reward steady speeds and aerodynamics. Different technologies land differently as a result.
- Conventional gasoline engines reach peak efficiency during highway cruising, where steady engine speeds and taller gearing minimize consumption.
- Hybrid powertrains excel in city traffic, where regenerative braking recharges the battery and electric motors handle low-speed acceleration without burning fuel.
- Plug-in hybrids offer electric-only operation for shorter daily trips, then continue as a conventional hybrid once the gas engine engages.
This is why a hybrid often posts a higher city figure than highway figure. That is the reverse of what most drivers expect.
What Is Good Fuel Economy for Sedans, SUVs, and Trucks?
There is no single good number. Fuel economy is relative to vehicle class. A rating that is unremarkable for a compact sedan is excellent for a full-size pickup.
One anchor helps. The EPA reports a record 27.2 MPG for the average model year 2024 new vehicle. That is an estimated real-world figure, and early data points to another gain in 2025. Anything well above it is strong for a mainstream vehicle.
Use these EPA-estimated combined ranges as a rough orientation. Conventional gas sedans typically fall between 30 and 40 MPG. Compact hybrid sedans reach well into the 50s. Compact crossovers generally land between 28 and 34. Midsize three-row SUVs sit between 20 and 26. Full-size trucks run between 18 and 24.
Segment, weight, and frontal area explain most of the spread.
- Sedans sit low with streamlined profiles, minimizing aerodynamic drag at speed.
- SUVs and crossovers carry more height, weight, and frontal area, which is precisely why hybrid versions recover so much efficiency in city driving.
- Pickup trucks are engineered around payload and towing, which requires larger or turbocharged engines that consume more fuel under load.
Drivetrain matters too. Front-wheel-drive layouts minimize weight and driveline friction. All-wheel drive and four-wheel drive cost some efficiency. The added transfer case and differential losses make the engine work harder. The EPA notes this explicitly. Four-wheel-drive vehicles are in fact tested in two-wheel drive.
We carry fourteen brands across our eighteen dealership locations. You can compare efficiency across segments in one conversation instead of four separate showrooms.
EPA-estimated fuel economy figures are for comparison purposes only. Your actual mileage will vary depending on driving conditions, how you drive and maintain your vehicle, battery age/condition, and other factors.
How Much Can Fuel-Efficient Vehicles Save in Long-Term Ownership Costs?
Start With Gallons, Not Dollars
The cleanest way to see the difference is in gallons, because gallons do not change when pump prices do.
A driver covering 15,000 miles a year burns 600 gallons at an EPA-estimated 25 MPG. The same driver burns 300 in a vehicle rated at an EPA-estimated 50 MPG. That is a 300-gallon difference every year. Multiply it by what you pay at the pump. You get your own figure instead of a national average that may not match your market. California pump prices run well above that national average, so the multiplier works harder here than almost anywhere else.
Cost Per Mile: Gasoline Versus Electric
Two formulas cover most of the comparison. Gasoline cost per mile equals pump price per gallon divided by MPG. Electric cost per mile equals your electricity rate per kilowatt-hour divided by miles per kilowatt-hour.
Running both with your own numbers matters more here than elsewhere. Residential electricity in California averages roughly 1.8 times the national rate, per U.S. Energy Information Administration data. That narrows the per-mile gap between an electric vehicle and an efficient hybrid. National averages tend to suggest a wider advantage than California drivers actually see. Time-of-use plans and overnight charging change the math a lot. Weighing an electrified vehicle? Our guide to home EV charging in California covers Level 1 versus Level 2 charging and what each one costs.
EPA-estimated fuel economy figures are for comparison purposes only. Your actual mileage will vary depending on driving conditions, how you drive and maintain your vehicle, battery age/condition, and other factors.
What Real-World Factors Cause Low Gas Mileage Compared to EPA Estimates?
EPA figures come from controlled laboratory conditions, so your results will differ. Sometimes below the label, sometimes above it. An AAA analysis of roughly 37,000 owner reports found something surprising. Eight in ten drivers beat their EPA combined rating. When results do fall short, the cause is usually one of a few controllable variables.
What the Department of Energy Measured
The Department of Energy measures how much each factor costs you. The estimates below come from its driving efficiency and vehicle maintenance research.
| Factor | Where It Hits Hardest | Estimated Impact on Fuel Economy |
|---|---|---|
| Aggressive driving | Speeding, hard acceleration, hard braking | 15% to 30% lower at highway speeds; 10% to 40% in stop-and-go traffic |
| Speeds above 50 mph | Sustained highway cruising | Each 5 mph over 50 mph costs roughly the same as paying $0.21 more per gallon |
| Air conditioning on Max | Hot weather, short trips | 5% to 25% lower than running without it |
| Roof-top cargo box | Interstate speeds | 2% to 8% in city driving; 6% to 17% on the highway; 10% to 25% at 65 to 75 mph |
| Rear-mounted cargo tray | Highway driving | 1% to 2% in city driving; 1% to 5% on the highway |
| Excess weight carried | Smaller vehicles more than larger ones | About 1% for every extra 100 pounds |
| Underinflated tires | All driving conditions | About 0.2% for every 1 PSI drop in average pressure across all tires |
| Excessive idling | Traffic, warm-ups, waiting | Burns a quarter to a half gallon per hour while producing zero miles |
| Cold weather and short trips | Trips too brief for the engine to warm | Reduced until the engine reaches operating temperature; worst on the shortest trips |
| Wrong grade of motor oil | Any vehicle not using the recommended grade | 1% to 2% lower than the manufacturer’s recommended grade |
What You Can Control
Keeping tires properly inflated improves gas mileage by about 0.6 percent on average, and up to 3 percent in the worst-inflated cases. Most of the factors above are habit or upkeep, not anything mechanical. That means most of them are recoverable. Has your fuel economy dropped while your driving has not changed? Schedule a diagnostic inspection with our service team, or call us at (909) 323-0539.
The information in this article is general guidance and does not constitute a specific diagnostic or repair recommendation for any individual vehicle. Repair and maintenance decisions should be made in consultation with a certified technician based on the specific condition of your vehicle.
Frequently Asked Questions About Vehicle Fuel Economy
How do I calculate my MPG if I forget to record the odometer reading during one fill-up?
Skip that fill-up entirely and resume on your next full tank. Estimating the missing distance introduces error that distorts your cumulative average. Clear the trip counter at the next complete fill-up, record the exact trip mileage and gallons dispensed at the following visit, and restart from that clean baseline.
Does driving with open windows use less gas than running the air conditioner?
It depends on speed. At lower speeds around town, open windows generally cost less fuel than the air conditioner, because aerodynamic drag is minimal and the compressor load is the larger penalty. At highway speeds the relationship reverses, and the Department of Energy recommends closing the windows and using the air conditioner. Published estimates of the exact crossover speed vary widely by vehicle and body style, so treat it as a guideline rather than a fixed number.
Will switching to premium grade fuel improve my vehicle’s MPG?
No. Dynamometer testing by AAA on engines designed for regular fuel found no meaningful improvement in fuel economy, horsepower, or emissions from premium gasoline. Higher octane resists detonation in high-compression and turbocharged engines; it is not higher-quality fuel. Follow the octane requirement in your owner’s manual rather than paying for a grade your engine cannot use.
Does replacing a clogged engine air filter improve my gas mileage?
Not on a modern vehicle. The Department of Energy states that replacing a clogged air filter on fuel-injected, computer-controlled gasoline engines, meaning essentially everything built since the early 1980s, does not improve fuel economy, though it can improve acceleration. Only older carbureted engines see a fuel economy benefit. Replace the filter for engine protection and throttle response, not for MPG.
How does tire pressure directly impact calculated fuel economy?
Underinflated tires flatten slightly against the road, increasing rolling resistance and forcing the engine to burn more fuel to hold speed. The Department of Energy estimates roughly 0.2 percent of fuel economy lost per 1 PSI of average underinflation. Check pressure monthly when the tires are cold, and use the figure on the driver’s door jamb rather than the maximum molded into the sidewall.
Why does stop-and-go traffic significantly lower gasoline mileage?
Accelerating a vehicle’s mass from a standstill demands high torque and peak fuel delivery, and stop-and-go driving does it repeatedly. Add the idling time between movements, which accumulates fuel burn without accumulating miles, and calculated MPG falls well below what steady highway cruising would produce.
The information in this article is general guidance and does not constitute a specific diagnostic or repair recommendation for any individual vehicle. Repair and maintenance decisions should be made in consultation with a certified technician based on the specific condition of your vehicle.
Maximizing Your Fuel Efficiency at OREMOR Automotive Group
Fuel economy comes down to two things. Choose a vehicle suited to how you actually drive. Then maintain it so it performs the way it was rated. Our group carries fourteen brands, so efficient options exist across nearly every segment. That includes hybrid sedans, plug-in hybrid crossovers, and efficient gasoline trucks.
Maintenance carries as much weight as the purchase decision. A few habits protect the efficiency your vehicle was engineered to deliver. Check tire pressure monthly. Use the manufacturer’s recommended grade of motor oil. Keep oil changes on schedule. Address a check engine light promptly. Our factory-trained technicians handle all of it.
Disclaimers
EPA-estimated fuel economy figures are for comparison purposes only. Your actual mileage will vary depending on driving conditions, how you drive and maintain your vehicle, battery age/condition, and other factors.
The information in this article is general guidance and does not constitute a specific diagnostic or repair recommendation for any individual vehicle. Repair and maintenance decisions should be made in consultation with a certified technician based on the specific condition of your vehicle.